Three Safety Metrics That Tell the Story
Safety metrics can tell the real story or bury it when trying to understand safety performance.
Safety Metrics Frustrate Company Leaders
We meet with a lot of leaders. We see a trend of company leaders frustrated over safety metrics. Their frustration is that the safety metrics are not catching less-than-stellar safety performance before it becomes a big problem.
Safety metrics should provide insights about the health of a safety management system. Safety metrics allow leaders to adjust and improve the processes that comprise their safety management systems. So having access to good data is essential.
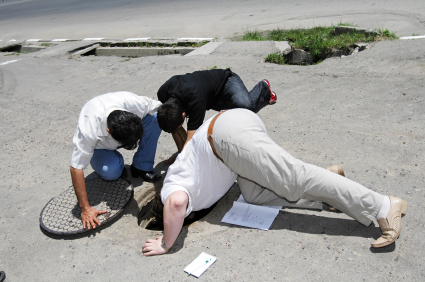
Here is an example where a company leader expressed frustration with the in-house safety metrics. An operating unit had a near-fatality that caught the attention of the Chief Operating Officer (COO). The COO asked us to perform an independent assessment of the situation.
The findings showed that warning signs were there, but the managers missed them. Part of the problem was that the safety metrics were not telling the story. The savvy COO wanted to know why and how groupthink had occurred.
The operating units report data upward each month. Corporate Safety crunches the numbers and sends safety metrics back down to the operating units. The operating units were receiving three safety metrics. These metrics are: Total OSHA Recordable Case Rate, Lost Time Injury Rate, and the consecutive days without a lost time incident.
The safety metrics were presented in spreadsheets and graphs. Two additional graphs were sent: charts of body part injured and injury by day of the week .
The operating units and division managers were glossing over the data. That’s when the problem became clear. They had no insightful data about their safety performance from which make decisions. At this company, like many, safety performance is heavily weighted by injury rates.
Why Wait for Injuries to Happen?
The COO asked the team this:
“Why are we making decisions based upon waiting for injuries to happen? We don’t make judgments about how to improve revenues and profitability by waiting until the end of the quarter to look at how unprofitable we were or how many customers we lost. We gather and interpret data every week to influence the end-of-the-quarter numbers.”
The COO nailed it. More and more company leaders are seeking an approach with insightful data.
Three Safety Metrics We Use
When we are trying to understand a SafeTask® user’s overall safety performance, we start with three safety metrics to understand the story:
Quarterly OSHA Recordable Injury Rate. We display this metric on a graph over a three year period, instead of a one year spread. The graph shows a mean and control limits. This metric demonstrates the long-term view. It indicates whether or not the overall management system is in control or producing random variation.
Average Weekly Safety Observation Score. We display this metric on a graph for the last 16-weeks. This metric indicates the recent trend of safe behaviors. It shows how well people apply safety margins during work tasks.
The value of this metric is that the data is real-time. In the SafeTask® System, we define safety performance by how well people apply safety margins to their tasks. We measure this critical relationship with rates of safe behaviors. It allows the SafeTask® user to understand the true safety performance, which is a huge advantage.
In this case, we showed the operating unit how to obtain observation data. We took a sample of safe behaviors to measure their baseline. The sample revealed that the average safety observation score was 33%. The target is 90% or greater. Even though the starting point was low, the operating unit was excited to have real-time data that they could act on without waiting for an injury to occur.
Correction Action Closure Percentage. We track this data over six months. Multiple safety processes in a management system generate corrective actions and action plans. The value of this metric is monitoring the engagement of the management team and workforce. If the management team and workforce have momentum, then they should close corrective actions at a consistent pace.
This SafeTask® user switched to these safety metrics. It implemented more insightful safety metrics to better understand its safety performance. By having more proactive data, it was able to affect changes that would later help them significantly increase their rate of safe behaviors and reduce their long-term injury rate.
These are the telltale safety metrics we use. These metrics objectively reveal the story about safety performance.